Market Observations & Portfolio Commentary
Income Equity – 2024 vs R1000V
Full Year Market Update
U.S. equities posted another strong year of performance in 2024, in almost a carbon copy of 2023’s robust gains. An easing of macro risks (lower inflation and a weakening labor market), a shift at the Federal Reserve to less restrictive monetary policy, and a late-year election bump drove market gains. And like last year, there was a wide dichotomy in leadership as the market favored larger cap growth over smaller cap value. While equity markets delivered strong headline gains in 2024, these returns were largely driven by multiple expansion, leaving valuations elevated and the market increasingly reliant on a handful of mega-cap leaders. Looking at market factors, Growth, Volatility, Size, and Momentum factors had the most positive impact on relative returns, while Value, Yield, and most of the Quality factors presented headwinds.
Key Performance Takeaways for the Year
-
The London Company Income Equity portfolio returned 12.3% (11.9% net) year-to-date vs. a 14.4% increase in the Russell 1000 Value Index. Stock selection was a headwind to relative performance, partially offset by positive sector exposure.
-
For the year, the Income Equity portfolio slightly trailed the Russell 1000 Value index, but strong relative performance in the second half brought up our upside participation to 85-90%—in line with expectations. The portfolio made up ground in 3Q as factors shifted our way. However, headwinds from exposure to Quality and Yield factors detracted from relative performance for the year.
-
Our portfolio positioning is always consistent with a focus on risk reduction, and we believe this bodes well for our approach in an expensive, concentrated market. We believe our focus on quality, diversification, and shareholder will continue to reinforce our margin of safety, positioning Income Equity portfolio for success in this uncertain climate.
Top 3 Contributors to Relative Performance
-
Progressive Corporation (PGR) – PGR outperformed during the year due to its success in growing the business and improving margins. PGR has gained market share from competitors and improved its margins by effectively segmenting underwriting risks and implementing strategic pricing. PGR has achieved its profitability target by lowering advertising costs and focusing on acquiring preferred customers. We remain confident in PGR’s ability to execute in all environments, competitive advantages, and capital allocation strategy.
-
Apple Inc. (AAPL) – Shares of AAPL rallied throughout the year after posting strong results with improvement in China and positive AI enhancements to products. AAPL also announced a $110B share repurchase authorization and a 4% increase in the dividend. iPhone revenue was down a bit although there were some moving pieces that made year-over-year comparisons challenging. Its large installed based and services are an important long-term driver of the business.
-
Philip Morris International Inc. (PM) – Shares of PM outperformed during the year mainly due to strong execution and an improving outlook. The smoke-free category remains the key driver with notable growth from ZYN nicotine pouches. IQOS growth is being fueled by innovation and smoker conversions, while the U.S. presents a major untapped commercialization opportunity. The successful portfolio shift has resulted in smoke-free products now accounting for nearly 40% of total net revenue and gross profit. Guidance points to continued acceleration in reduced-risk product adoption, which should drive overall volume growth and market share gains. We believe the combination of smoke-free growth potential and a resilient combustibles portfolio will generate significant and sustainable free cash flow in the years ahead.
Top 3 Detractors from Relative Performance
-
Nestle S.A. (NSGRY) – NSRGY shares underperformed the broader market all year. Sentiment across the packaged food space is weak as it emerges from two years of unprecedented food price inflation. NSRGY’s latest earnings report did not suggest an acceleration in organic growth from current subdued trends. NSRGY’s portfolio is attractively positioned in categories that have stable, long-term volume tailwinds such as coffee, pet food, and nutritional health. Barring further executional missteps, we believe the downside to the current stock price is low.
-
Merck & Co., Inc. (MRK) – MRK’s underperformance for the year reflected a weaker outlook for its HPV vaccine amid challenges in the China market, along with concerns about the incoming administration. Certain pharma stocks have come under pressure since the election and subsequent Presidential nominations for healthcare positions, as the market digests potential policy implications. Despite these headwinds, MRK continues to show strength across its portfolio, particularly with Keytruda, which is driving growth and showing promise in new launches and combination therapies. The company has successfully expanded its pipeline through effective R&D and acquisitions. We believe MRK’s strong drug and vaccine portfolio combined with effective leadership positions it well for continued growth.
-
United Parcel Service, Inc. (UPS) – UPS underperformed this year due to the challenging transportation and parcel market. Many foreign economies have been weak in recent months and economic growth in the U.S. has shifted to services from goods (negative for shipping companies). Weaker revenue growth along with higher union contract wages led to lower margins. While recent results have been lackluster, we maintain our confidence in the long-term growth opportunities in the global package delivery business. The dividend yield is roughly 5% and management continues to return cash to shareholders via dividends and share repurchase at attractive prices.
Sector Influence
We are bottom-up stock pickers, but sector exposures influenced relative performance as follows:
-
What Helped: Underweight Health Care & Energy (two weaker performing sectors)
-
What Hurt: Underweight Utilities (a better performing sector) & overweight Information Technology (a weaker performing sector)
Portfolio Characteristics & Positioning
We believe the Income Equity portfolio is positioned for long-term durability and possesses the fundamental ingredients that stand the test of time: wide moats, sustainably high returns on capital, strong free cash flow generation, low leverage ratios, and an attractive shareholder yield (dividends + net buybacks). The portfolio trades at a premium to the Value index, but we believe this is justified as companies in the Value indices have lower returns on capital and higher leverage. As a corporate debt maturity wall approaches and the cost of that capital stays elevated, we believe companies with strong balance sheets and the ability to self-fund their operations could have a structural advantage in 2025 and beyond. In an environment of possibly lower returns and greater volatility, we believe the Income Equity portfolio offers an attractive option for equity investors.
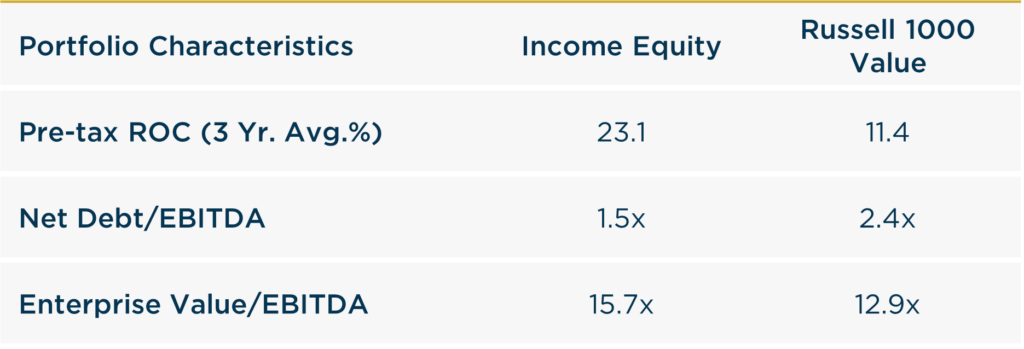
Source: FactSet
Looking Ahead
As we enter 2025, we believe the market faces an inflection point where sustaining momentum becomes increasingly difficult. Across the real economy, demand still seems sluggish and clear late-cycle signals persist. Revenue growth and corporate profits have leaned on inflationary pricing, but margins face growing headwinds as inflationary pricing fades, input costs rise, and demand softens. The Fed cut rates during 2024, but the yields on longer-dated treasuries actually rose as the year ended. Stubbornly high borrowing costs continue to plague rate-sensitive areas of the economy, like housing. Employment and inflation data may be volatile in 2025 and could affect changes in monetary policy and lead to greater volatility across equity markets.
Despite resilient economic data and limited signs of credit risk, we believe vigilance is warranted. Our cautious posture persists due to high valuations, market concentration, looming debt challenges, and fraying consumer health. We anticipate lower expected returns in the near term, based on slowing growth (function of restrictive monetary policy) and high valuations. Valuation multiple expansion can only take the market so far (particularly late in a market cycle). We expect a reversion to the mean whereby earnings growth & dividends drive returns going forward. While optimism remains high, the vulnerabilities of momentum-driven leadership highlight the need for discipline. Markets may reward risk-taking in the short term, but lasting wealth is built through patience, real income, and fundamentals.
We believe the Income Equity portfolio is positioned for long-term durability and possesses the fundamental ingredients that stand the test of time.
Annualized Returns
As of 12/31/2024
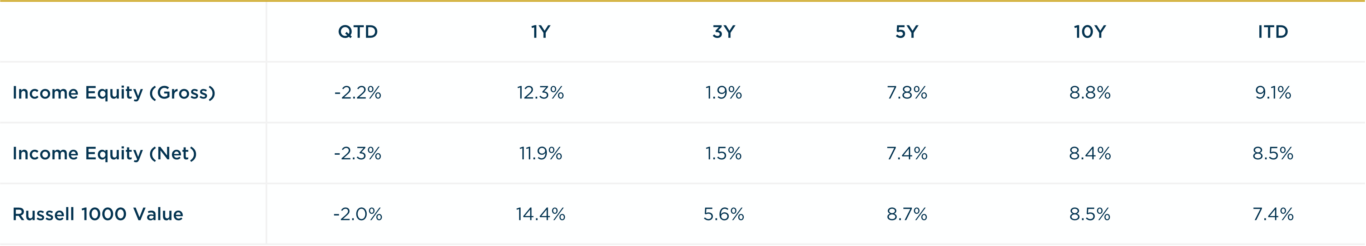
Inception date: 12/31/1999. Past performance should not be taken as a guarantee of future results. Performance is preliminary. Subject to change.