Market Observations & Portfolio Commentary
Mid Cap – 2024 vs. RMC
Full Year Market Update
U.S. equities posted another strong year of performance in 2024, in almost a carbon copy of 2023’s robust gains. An easing of macro risks (lower inflation and a weakening labor market), a shift at the Federal Reserve to less restrictive monetary policy, and a late-year election bump drove market gains. And like last year, there was a wide dichotomy in leadership as the market favored larger cap growth over smaller cap value. While equity markets delivered strong headline gains in 2024, these returns were largely driven by multiple expansion, leaving valuations elevated and the market increasingly reliant on a handful of mega-cap leaders. Looking at market factors, Growth, Volatility, Size, and Momentum factors had the most positive impact on relative returns, while Value, Yield, and most of the Quality factors presented headwinds.
Key Performance Takeaways for the Year
-
The London Company Mid Cap portfolio returned 9.4% (9.1% net) year-to-date vs. a 15.3% increase in the Russell Midcap Index. Both stock selection and sector exposure were headwinds to relative performance.
-
Our Mid Cap portfolio produced solid absolute returns, but it trailed its benchmark and came up short of our 85-90% upside participation expectations. Over 50% of the headwind was sector related. Our factor exposure (limited Momentum, Growth or Volatility) and weakness in several holdings presented additional obstacles to relative performance. While the short-term report card hasn’t been as favorable this year as the prior two years, the longer-term performance remains strong.
-
Looking ahead, the opportunity down the market cap spectrum is meaningful. Valuations are at historically attractive levels for smaller companies compared to large caps. That said, there is a need to stay up in quality given the elevated rate backdrop, the corporate debt wall maturity approaching, and sluggish demand environment. We believe our Mid Cap portfolio is well positioned to capitalize on attractive relative valuations while avoiding the pitfalls associated with lower-quality, smaller cap companies.
Top 3 Contributors to Relative Performance
-
Allison Transmission Holdings, Inc. (ALSN) – ALSN shares significantly outperformed the broader market during the year after reporting four strong quarters of results reflecting top-line growth, pricing power, and margin expansion. Segments generally performed well aside from North American off-market, which has significant energy exposure. We are also starting to see the company’s defense end-market strategy paying off as the world readies for growing geopolitical tensions. We continue to like the company’s wide moat and solid management team.
-
Armstrong World Industries, Inc. (AWI) – AWI shares outperformed as the company continues to exhibit strong sales and earnings growth amidst muted market conditions. Markets are beginning to stabilize and should return to low single digit growth, with the recovery led by new construction, renovation, and growth initiatives. Positive trends in transportation, education, health care, and data centers gives us confidence that the company will continue to execute.
-
M&T Bank Corporation (MTB) – MTB outperformed in 2024 on a series of positive financial updates and the reinstatement of its share repurchase program. MTB is well positioned going forward, having built capital and reduced its exposure to commercial real estate loans. We have a favorable view of MTB management, and we expect the bank to continue compounding value for shareholders while serving its customers well and managing credit effectively through cycles.
Top 3 Detractors from Relative Performance
-
Dollar Tree, Inc. (DLTR) – DLTR faced pressures this year from industry-wide weakness in discretionary purchases, the ongoing battle with cost inflation, and a realization that the Family Dollar turnaround efforts were not bearing fruit. For these reasons, DLTR revised its EPS guidance down by >20% throughout the year. We also saw a regime change at year-end with Rick Dreiling (CEO and Chairman) stepping down and the CFO shortly after him. The strategic review of Family Dollar is ongoing, and we believe a separation of this asset would immediately be accretive to DLTR’s EPS. This is before considering a potentially large tax benefit that could result from a sale. On a go-forward basis, we are optimistic about the optionality inherent in the Dollar Tree banner. The banner is in early innings of its multi-price point conversion and capital is available to reinvest into this higher return retail concept now that Family Dollar is viewed as non-core.
-
Lamb Weston Holdings, Inc. (LW) – LW underperformed the benchmark during the year due to excess industry supply limiting pricing gains, poor execution on its ERP rollout, market share losses, and weak restaurant foot traffic. While there are short-term tailwinds, the long-term industry drivers remain attractive. We remain attracted to LW’s flexible balance sheet, leading market share, capital allocation strategy, and industry tailwinds.
-
Entegris, Inc. (ENTG) – ENTG lagged during the year with more pronounced weakness in the second half. Management extended the recovery timeline for semiconductors due to sluggish demand in older technologies and the timing of new nodes. That said, ENTG benefits from the higher amount of materials needed for new technologies and is winning business as its products deliver faster yield times. We remain attracted to the industry’s high barriers to entry, limited competitors, and high switching costs.
Sector Influence
We are bottom-up stock pickers, but sector exposures influenced relative performance as follows:
-
What Helped: Overweight Industrials (a better performing sector) & underweight Health Care (a weaker performing sector)
-
What Hurt: Overweight in both Consumer Staples & Materials (weaker performing sectors)
Portfolio Characteristics & Positioning
We believe the Mid Cap portfolio is positioned for long-term durability and possesses the fundamental ingredients that stand the test of time: wide moats, sustainably high returns on capital, strong cash flow generation, low leverage ratios, and trading at a reasonable valuation. As a corporate debt maturity wall approaches and the cost of that capital stays elevated, we believe companies with strong balance sheets and the ability to self-fund their operations could have a structural advantage in 2025 and beyond. In an environment of possibly lower returns and greater volatility, we believe the Mid Cap portfolio offers an attractive option for equity investors.
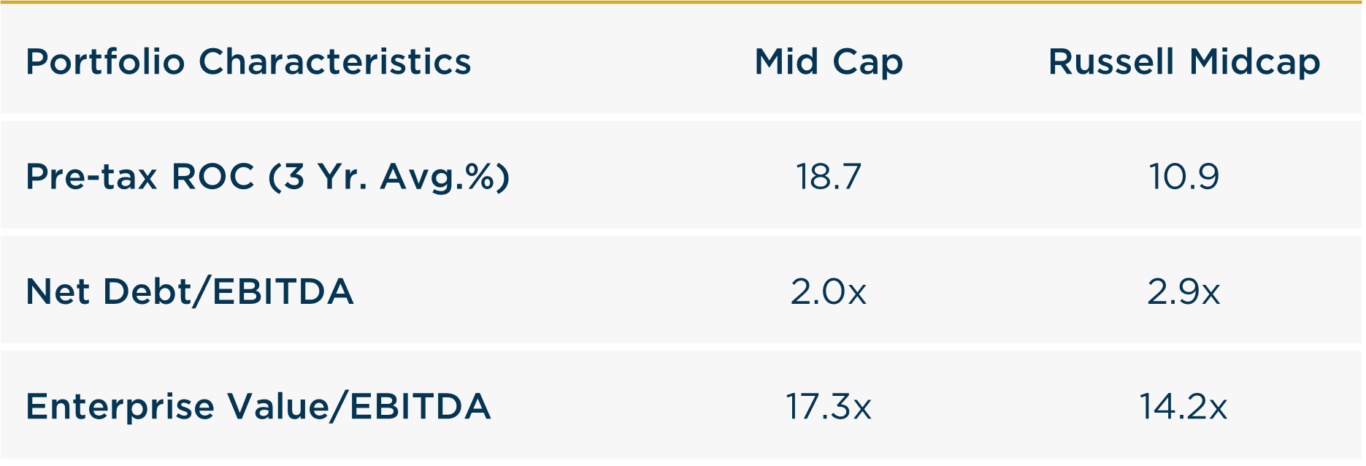
Source: FactSet
Looking Ahead
As we enter 2025, we believe the market faces an inflection point where sustaining momentum becomes increasingly difficult. Across the real economy, demand still seems sluggish and clear late-cycle signals persist. Revenue growth and corporate profits have leaned on inflationary pricing, but margins face growing headwinds as inflationary pricing fades, input costs rise, and demand softens. The Fed cut rates during 2024, but the yields on longer-dated treasuries actually rose as the year ended. Stubbornly high borrowing costs continue to plague rate-sensitive areas of the economy, like housing. Employment and inflation data may be volatile in 2025 and could affect changes in monetary policy and lead to greater volatility across equity markets.
Despite resilient economic data and limited signs of credit risk, we believe vigilance is warranted. Our cautious posture persists due to high valuations, market concentration, looming debt challenges, and fraying consumer health. We anticipate lower expected returns in the near term, based on slowing growth (function of restrictive monetary policy) and high valuations. Valuation multiple expansion can only take the market so far (particularly late in a market cycle). We expect a reversion to the mean whereby earnings growth & dividends drive returns going forward. While optimism remains high, the vulnerabilities of momentum-driven leadership highlight the need for discipline. Markets may reward risk-taking in the short term, but lasting wealth is built through patience, real income, and fundamentals.
We believe the Mid Cap portfolio is positioned for long-term durability and possesses the fundamental ingredients that stand the test of time.
Annualized Performance
As of 12/31/2024
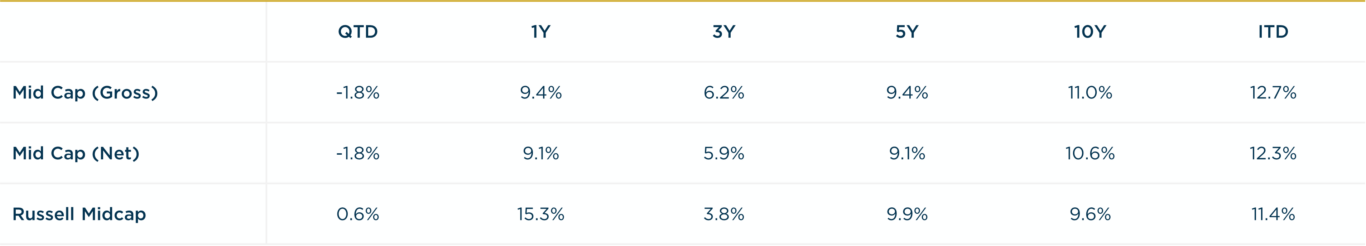
Inception date: 3/31/2012. Past performance should not be taken as a guarantee of future results. Performance is preliminary. Subject to change.