Market Observations & Portfolio Commentary
Income Equity – 1Q2025 vs Russell 1000
Market Update
U.S. equities entered correction territory in 1Q25 after notching two robust years of strong gains. Macro risks returned to the forefront of investors’ minds as tariff and austerity uncertainties compounded stubbornly weak economic growth and a return of the inflation specter. Broader market weakness was driven by negative earnings revisions, declining consumer and business confidence, and no change in monetary policy from the Federal Reserve. For the quarter, the broader market, as measured by the Russell 3000 Index, declined 4.7%. A faltering Artificial Intelligence growth narrative allowed for a broadening of market leadership. Value styles led Growth, and Large Caps outperformed Small Caps. Turning to market factors, Value and Yield factors posted the strongest returns. Most of the Quality factors outperformed as well. Growth, Volatility (high beta), and Momentum factors had a negative impact.
Key Performance Takeaways
-
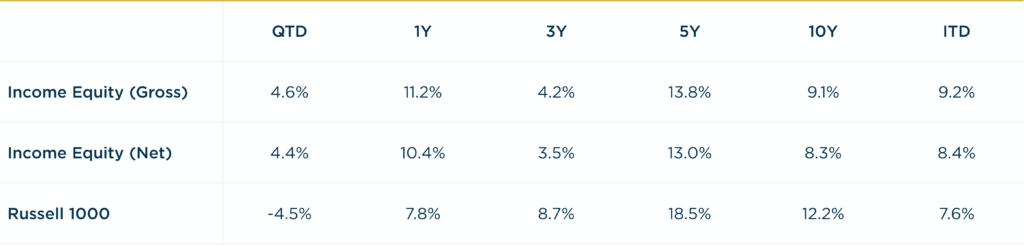
The London Company Income Equity portfolio returned 4.6% (4.4% net) during the quarter vs. a 4.5% decrease in the Russell 1000 Index. Sector exposure and stock selection were both tailwinds to relative performance.
-
The Income Equity portfolio produced positive absolute returns in a down quarter for the Russell 1000, exceeding our downside protection expectations. Our exposure to Yield, Lower Volatility & Quality factors shined as the high beta and momentum driven equities sharply corrected. We were encouraged to see the portfolio play strong defense amidst the volatility with compelling participation as the market broadened.
Top 3 Contributors to Relative Performance
-
Philip Morris International Inc. (PM) – PM shares outperformed due to strong execution and an improving outlook. The primary driver remains the success of its smoke-free products, with sustained momentum in IQOS and ZYN, supported by robust pricing in the combustibles portfolio. We believe the combination of smoke-free growth potential and a resilient combustibles business will generate significant and sustainable free cash flow in the years ahead.
-
Progressive Corporation (PGR) – PGR outperformed during the quarter, driven by improved margins, faster growth than the industry, and a rise in policies in force. PGR’s superior underwriting risk segmentation continues to translate to industry-leading accident frequency outcomes. We remain confident in PGR’s ability to execute in all environments, competitive advantages, and capital allocation strategies.
-
Nintendo Co., Ltd ADR (NTDOY) – NTDOY was a top performer driven by excitement surrounding the Switch 2 launch, with management expressing optimism about early demand signals and increasing production capacity accordingly. This positive momentum aligns with our long-term thesis, reinforcing our confidence in the company’s potential for a highly successful and profitable console cycle.
Top 3 Detractors from Relative Performance
-
United Parcel Service, Inc. (UPS) – Despite reporting strong quarterly results with improved margins and revenue growth, UPS’s stock declined due to the announcement of a planned 50% reduction in Amazon volumes by 2026. Decreasing the Amazon contract should improve profitability. UPS has continued to proactively cut costs and focus on higher-margin segments. We remain attracted to UPS’s strong global network, recovery in freight, and management’s commitment to returning capital to shareholders.
-
Merck & Co, Inc. (MRK) – MRK shares continue to be impacted by lower outlook for its HPV vaccine amid challenges in China along with weaker industry sentiment. We exited our position this quarter due to concerns over the company’s ability to expand its pipeline through R&D and acquisitions, limiting its diversification ahead of the Keytruda patent expiration.
-
Diageo plc (DEO) – DEO continues to face weaker consumer demand and an uncertain recovery timeline, with macro headwinds and strategic investments impacting earnings. New import tariffs have also added to the uncertainty. However, DEO’s strong global presence and diverse portfolio position it well in the industry. With a proven track record of successful portfolio management, brand building, and innovation, we remain confident in management’s ability to deliver long-term shareholder value.
Sector Influence
We are bottom-up stock pickers, but sector exposures influenced relative performance as follows:
-
What Helped: Underweight Information Technology (a weaker performing sector) & overweight Financials (a better performing sector)
-
What Hurt: Underweight both Health Care and Energy (better performing sectors)
Trades During the Quarter
-
Initiated: Corning Inc (GLW) – Company manufactures specialty glass, ceramics, and optical products for a wide range of industries including telecommunications, consumer electronics, automotive, and life sciences. GLW’s innovation-driven model spans Display, Optical Communications, Specialty Materials, and Environmental Technologies, providing multiple revenue streams. GLW benefits from AI-driven demand, as its fiber optic cables are essential for high-speed data transmission in AI data centers. More AI computing power requires more fiber connectivity. GLW’s high fixed costs mean revenue growth should drive margin expansion with limited incremental costs. Robust R&D spend and centralized innovation create a cost advantage, strengthening GLW’s moat. ROIC improved to 12.5% in FY24. Management has a solid track record of capital allocation. The company boasts a 2%+ dividend yield, has increased buybacks over the past decade, and maintains a healthy balance sheet. We have owned GLW shares in the past and maintain a positive view due to their history of innovation and ability to generate diversified revenue streams. We believe the company is positioned for strong revenue growth stemming from secular and cyclical trends in Display and Optical Communications.
-
Sold: Merck & Co., Inc. (MRK) – Sale reflects concerns surrounding the impending Keytruda patent cliff and the potential for dilutive acquisitions. The patent cliff concern has intensified following challenges faced by Gardasil in China and uncertainties surrounding the company’s vaccine business in the current regulatory environment.
Looking Ahead
There is elevated uncertainty as we start the second quarter with a high likelihood of greater tariffs being announced in the weeks ahead. Consumer confidence has declined recently due to the risks of additional tariffs, but the broader economic data still supports growth in the near term, but growth is decelerating. While we are not predicting a recession, the odds of a recession have increased. In terms of monetary policy, the Fed appears to be on a steady course for two or three rate cuts later in the year. The effect of tariffs on both inflation and the broader economy could change those plans though.
Despite the recent correction, the market concentration and valuations remain elevated. History shows that transitions following peak market concentration (e.g. the Nifty Fifty or the Tech Bubble) tend to play out over multiple years—not quarters. The cap-weighted indices may continue to face pressure as investors reassess stretched valuations and excessive positioning. We believe that equity returns in the near term may be modest, with shareholder yield (dividends, share repurchase, debt reduction) comprising a significant percentage of the total return from equities. Defensive portfolios such as ours should be favored areas for investors if recession concerns remain or materialize. Importantly, Quality factors have historically posted their best relative returns during periods of decelerating growth and through recessions. Quality factors typically lag in the early days of a recovery and keep pace during the mid-cycle years. We may be late in the economic cycle now. If that is correct, it bodes well for the relative performance of Quality factors over the next few years and for our portfolios.
Annualized Returns
As of 3/31/2025
Inception date: 12/31/1999. Performance is preliminary. Subject to change. Past performance should not be taken as a guarantee of future results. Net of fee returns are calculated net of a model management fee of 0.75%. Please see the disclosure notes found on the bottom of the page.