Market Observations & Portfolio Commentary
Large Cap – 1Q2025 vs. Russell 1000
Market Update
U.S. equities entered correction territory in 1Q25 after notching two robust years of strong gains. Macro risks returned to the forefront of investors’ minds as tariff and austerity uncertainties compounded stubbornly weak economic growth and a return of the inflation specter. Broader market weakness was driven by negative earnings revisions, declining consumer and business confidence, and no change in monetary policy from the Federal Reserve. For the quarter, the broader market, as measured by the Russell 3000 Index, declined 4.7%. A faltering Artificial Intelligence growth narrative allowed for a broadening of market leadership. Value styles led Growth, and Large Caps outperformed Small Caps. Turning to market factors, Value and Yield factors posted the strongest returns. Most of the Quality factors outperformed as well. Growth, Volatility (high beta), and Momentum factors had a negative impact.
Key Performance Takeaways
-
The London Company Large Cap portfolio returned 2.4% (2.3% net) during the quarter vs. a 4.5% decrease in the Russell 1000 Index. Both stock selection and sector exposure were tailwinds to relative performance.
-
The Large Cap portfolio produced positive absolute returns in a down quarter for the Russell 1000, exceeding our downside protection expectations. Our exposure to Lower Volatility and Quality factors shined as high beta and momentum driven equities sharply corrected. We were encouraged to see the portfolio play strong defense amidst the volatility with compelling participation as the market broadened.
Top 3 Contributors to Relative Performance
-
Progressive Corporation (PGR) – PGR outperformed during the quarter, driven by improved margins, faster growth than the industry, and a rise in policies in force. PGR’s superior underwriting risk segmentation continues to translate to industry-leading accident frequency outcomes. We remain confident in PGR’s ability to execute in all environments, competitive advantages, and capital allocation strategies.
-
Berkshire Hathaway Inc. Class B (BRK.B) – BRK.B stock outperformed in the quarter, which we believe is attributable to a broader flight to safety amidst the turbulence and uncertainty of executive actions from President Trump. We like the company for its diversified operations, conservative underwriting, strong balance sheet, and prudent management team.
-
Republic Services, Inc. (RSG) – RSG outperformed the index due to stronger-than-expected earnings and consistent performance, even with flat volume growth expectations. RSG continues to expand margins through improved customer mix, strategic pricing, and cost management. We remain attracted to the steady free cash flow growth, annuity-like revenues, and high market share of U.S. landfill capacity.
Top 3 Detractors from Relative Performance
-
FedEx Corporation (FDX) – FDX shares lagged this quarter due to underwhelming segment results due to a slowing freight backdrop. Management implemented an aggressive cost-cutting plan to improve margins. Despite these challenges, we remain optimistic about FDX’s long-term outlook as the Freight separation could unlock value and its network is well-positioned to benefit from a freight recovery.
-
Bruker Corporation (BRKR) – BRKR shares lagged this quarter due to uncertainties over NIH funding and tariffs. The CEO stepped up and bought more shares amid the weakness. We remain optimistic about BRKR for its vital role in life sciences research, a global economic priority, supported by its robust competitive stance, innovative products, strategic capital allocation, and capable leadership.
-
Alphabet Inc. (GOOG) – GOOG was a bottom performer this quarter despite strong results from its ad business, Cloud growth, and margin enhancements. Unexpectedly high capex guidance and AI search alternatives pressured the stock. GOOG has a solid balance sheet, significant market share, and generates strong returns on invested capital.
Sector Influence
We are bottom-up stock pickers, but sector exposures influenced relative performance as follows:
-
What Helped: Underweight position in Information Technology (a weaker performing sector) and overweight in Financials (a better performing sector)
-
What Hurt: Underweight position in both Health Care and Utilities (better performing sectors)
Trades During the Quarter
-
Reduced: BlackRock, Inc. (BLK) Trim reflects some concerns around potential fee pressures due to lower prices at Vanguard and our large exposure to the Financials sector.
-
Initiated: Entegris, Inc. (ENTG) – ENTG produces specialty materials for microelectronics industry, and is a semiconductor spending play that is well positioned for future growth. The company sells chemicals (gases), filters, and containers for handling chemicals and chips. Capital spending in the semiconductor industry has significantly increased over the years as chip manufacturing is more closely tied with semi-chip acreage growth and consumer demand trends i.e. IoT, mobility, big data, telematics, etc. The industry has high barriers to entry, few competitors, and high switching costs. Compared to its competition, ENTG is well diversified across products and clients. ENTG is a high margin, high ROIC business that is managed by a seasoned, transparent management team. We own ENTG in other TLC portfolios.
-
Increased: Entegris, Inc. (ENTG) – Added to the position making ENTG roughly 3% of the portfolio. Addition reflects our optimistic outlook for semiconductor spending longer term. Growth in wafer starts and higher content per wafer are positives for ENTG.
-
Exited: Home Depot, Inc. (HD) – Sale reflects a relatively high valuation (18.6x trailing EBITDA) along with a mixed outlook for consumer spending and housing activity. While the aging housing base and stable housing values are a positive for home improvement spending, we note that we already have exposure via Lowe’s and didn’t feel the need to own both companies.
- Increased: Old Dominion Freight Line, Inc. (ODFL) – We used excess cash to add to ODFL. The company has been under pressure due to the prolonged freight environment, but is positioned strongly for an eventual recovery. It is worth noting, the CFO purchased over $400K recently.
Looking Ahead
There is elevated uncertainty as we start the second quarter with a high likelihood of greater tariffs being announced in the weeks ahead. Consumer confidence has declined recently due to the risks of additional tariffs, but the broader economic data still supports growth in the near term, but growth is decelerating. While we are not predicting a recession, the odds of a recession have increased. In terms of monetary policy, the Fed appears to be on a steady course for two or three rate cuts later in the year. The effect of tariffs on both inflation and the broader economy could change those plans though.
Despite the recent correction, the market concentration and valuations remain elevated. History shows that transitions following peak market concentration (e.g. the Nifty Fifty or the Tech Bubble) tend to play out over multiple years—not quarters. The cap-weighted indices may continue to face pressure as investors reassess stretched valuations and excessive positioning. We believe that equity returns in the near term may be modest, with shareholder yield (dividends, share repurchase, debt reduction) comprising a significant percentage of the total return from equities. Defensive portfolios such as ours should be favored areas for investors if recession concerns remain or materialize. Importantly, Quality factors have historically posted their best relative returns during periods of decelerating growth and through recessions. Quality factors typically lag in the early days of a recovery and keep pace during the mid-cycle years. We may be late in the economic cycle now. If that is correct, it bodes well for the relative performance of Quality factors over the next few years and for our portfolios.
Annualized Returns
As of 3/31/2025
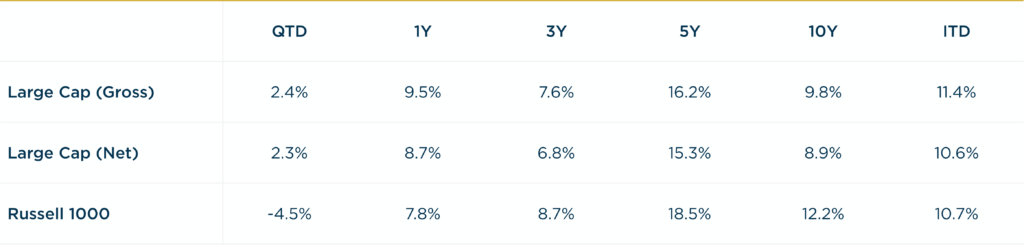
Inception date: 6/30/1994. Performance is preliminary. Subject to change. Past performance should not be taken as a guarantee of future results. Net of fee returns are calculated net of a model management fee of 0.75%. Please see the disclosure notes found on the bottom of the page.