Market Observations & Portfolio Commentary
Small Cap – 1Q2025 vs. Russell 2000
Market Update
U.S. equities entered correction territory in 1Q25 after notching two robust years of strong gains. Macro risks returned to the forefront of investors’ minds as tariff and austerity uncertainties compounded stubbornly weak economic growth and a return of the inflation specter. Broader market weakness was driven by negative earnings revisions, declining consumer and business confidence, and no change in monetary policy from the Federal Reserve. For the quarter, the broader market, as measured by the Russell 3000 Index, declined 4.7%. A faltering Artificial Intelligence growth narrative allowed for a broadening of market leadership. Value styles led Growth, and Large Caps outperformed Small Caps. Turning to market factors, Value and Yield factors posted the strongest returns. Most of the Quality factors outperformed as well. Growth, Volatility (high beta), and Momentum factors had a negative impact.
Key Performance Takeaways
-
The London Company Small Cap portfolio declined 6.9% (-7.1% net) during the quarter vs. a 9.5% decrease in the Russell 2000 Index. Relative outperformance was driven by positive stock selection, partially offset by sector exposure headwinds.
-
The Small Cap portfolio outperformed its benchmark in Q1, and exceeded our 75-80% downside capture expectations. We benefited from our defensive, lower volatility posture, but Quality factors were somewhat mixed during the period.
Top 3 Contributors to Relative Performance
-
ACI Worldwide, Inc. (ACIW) – ACIW yielded resiliency in a down market. The business is quite stable, with a high rate of recurring revenues and ~12-month visibility on revenues due to the backlog. The organic growth rate of the company continues to persist at structurally higher rates. ACIW is a cash generative business that has recently seen improved cash conversion and subsequently we have benefitted from increased shareholder returns.
-
Hanover Insurance Group, Inc. (THG) – THG outperformed in the quarter due to strong 4Q24 earnings and 2025 outlook. The thesis is playing out as the company is trending towards high-teens ROE as margins normalize following a flurry of underwriting actions. We like the underwriting-focused culture, niche competitive positioning, and astute management team.
-
Somnigroup International (SGI) – SGI continues to perform well despite weak industry demand. The approval of the Mattress Firm deal during the quarter is a major development, offering long-term benefits through vertical integration and enhancing its competitive position. Valuation remains compelling and our investment thesis is supported by robust free cash flow generation, strong brand equity, and solid management execution.
Top 3 Detractors from Relative Performance
-
DoubleVerify Holdings, Inc. (DV) – DV shares were weak due to customer-specific issues, as pullbacks from major global brand clients with large ad budgets heavily impacted growth. We remain optimistic about DV’s near-term stabilization, driven by a high-profile product launch earlier this year and emerging cross-sell opportunities, bolstered by its strong competitive position in a favorable market structure that supports profitable long-term growth.
-
Moelis & Co. Class A (MC) – MC shares were weak, reflecting uncertainty in the market, impacting the M&A environment. We continue to like MC’s debt-free balance sheet, strong shareholder focus, and willingness to reinvest in the business.
-
Revolve Group, Inc (RVLV) – RVLV sold off heavily in the first quarter as tariff developments pressured sentiment. The company reported notable sales and margin momentum. We remain confident in the company due to its premium-priced retailer status, high full-price sell-through rate, and proven ability to pass through tariffs in 2019. Additionally, RVLV’s self-help initiatives targeting operating expenses should help offset any gross margin challenges.
Sector Influence
We are bottom-up stock pickers, but sector exposures influenced relative performance as follows:
-
What Helped: Overweight position in both Consumer Staples and Real Estate (better performing sectors)
-
What Hurt: Underweight Utilities (better performing sector) and overweight Consumer Discretionary (weaker performing sector)
Trades During the Quarter
-
Exited: Cannae Holdings, Inc. (CNNE) – sold CNNE on weakness, with lower confidence in the ability of the various holdings in the company (Dun and Bradstreet and ALIT account for most of the value) to generate solid results over time. We maintained a position in CNNE in the small/mid cap portfolio.
-
Reduced: Somnigroup International Inc (SGI) – We trimmed SGI after the closing of the acquisition of Mattress Firm. The company’s market cap now exceeds $11B and we need to start moving SGI out of the small cap portfolio.
-
Initiated: Atkore Inc (ATKR) – ATKR dominates the electrical conduit market with 35% market share, offering bundled products – conduits, PVC, HDPE pipes, and other electrical raceway products. ATKR benefits from oligopolistic industry dynamics with only 2 competitors possessing comparable scale, translating to scale advantages. It operates mainly in U.S. non-residential construction and is levered to trends like electrification and data center growth. The company has improved margins (5% to ~11% normalized) and ROIC (>14%) through diversification and proactive pricing strategies. ATKR requires minimal capex and generates strong cash flow. Most of the cash generated is used for effective share repurchases, a small dividend, and acquisitions. ATKR has retired more than 45% of outstanding shares since 2017.
-
Increased: UniFirst Corporation (UNF) – We added to UNF as we believe there is a high likelihood of margin improvement along with solid revenue growth in the years ahead. Separately, Cintas has made an offer to buy UNF at a higher price and could increase the bid in the future.
-
Increased: Ingevity Corporation (NGVT) – We added to NGVT on weakness, as we believe the sum of the parts is attractive. While the performance chemicals division has been weak, we believe the performance materials division should be strong driven by more restrictive global emission standards for vehicles.
Looking Ahead
There is elevated uncertainty as we start the second quarter with a high likelihood of greater tariffs being announced in the weeks ahead. Consumer confidence has declined recently due to the risks of additional tariffs, but the broader economic data still supports growth in the near term, but growth is decelerating. While we are not predicting a recession, the odds of a recession have increased. In terms of monetary policy, the Fed appears to be on a steady course for two or three rate cuts later in the year. The effect of tariffs on both inflation and the broader economy could change those plans though.
Despite the recent correction, the market concentration and valuations remain elevated. History shows that transitions following peak market concentration (e.g. the Nifty Fifty or the Tech Bubble) tend to play out over multiple years—not quarters. The cap-weighted indices may continue to face pressure as investors reassess stretched valuations and excessive positioning. We believe that equity returns in the near term may be modest, with shareholder yield (dividends, share repurchase, debt reduction) comprising a significant percentage of the total return from equities. Defensive portfolios such as ours should be favored areas for investors if recession concerns remain or materialize. Importantly, Quality factors have historically posted their best relative returns during periods of decelerating growth and through recessions. Quality factors typically lag in the early days of a recovery and keep pace during the mid-cycle years. We may be late in the economic cycle now. If that is correct, it bodes well for the relative performance of Quality factors over the next few years and for our portfolios.
Annualized Returns
As of 3/31/2025
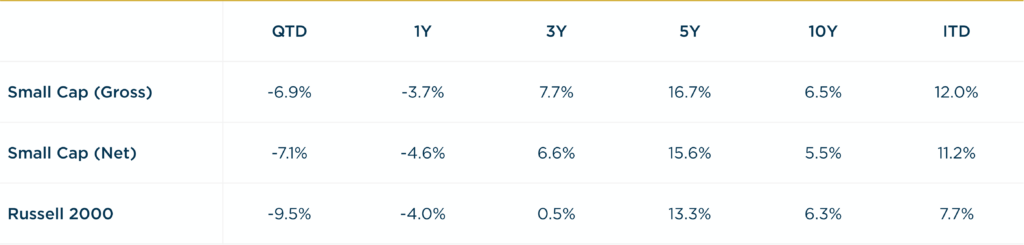
Inception date: 9/30/1999. Performance is preliminary. Subject to change. Past performance should not be taken as a guarantee of future results. Net of fee returns are calculated net of a model management fee of 1.00%. Please see the disclosure notes found on the bottom of the page.